









The Bureau of Labor Statistics estimates that, this decade, roughly 60% of jobs will not require applicants to have an associate’s, bachelor’s or graduate degree — an evolution that is not accidental, but rather the result of several shifts within the U.S. labor market. Among a variety of driving factors, the mounting cost of college education is the most obvious incentive for young people to take alternative paths that would allow them to avoid acquiring crippling debt. Given the context of recent generations looking for ways to break from a heavily encumbered status quo, we conducted an analysis that aimed to understand and classify the various U.S. labor environments with particular focus on the opportunities they each present for mid-skill worker career advancement.
The Mechanics of Mobility
Granted, there remains a gap between corporate policy that aims to prioritize relevant skills and experience over academic credentials and actual hiring practices. Yet, the viability of these alternative career pathways is heavily dependent on geography: Because industry clusters, corporate density, and local economic policies vary drastically across the country, a mid-skilled worker’s prospects look entirely different depending on their location.
For example, in some metropolitan areas, booming infrastructure and manufacturing sectors naturally fast-track workers into high-paying roles, whereas, in others, a heavy reliance on public sector roles leads to higher barriers of entry and less job-to-job mobility in exchange for stability and predictability. With all of that in mind and in order to draw specific metro area profiles, we looked at several indicators that we feel relevantly differentiate the various labor markets across the United States (see the methodology section for a detailed breakdown of each).
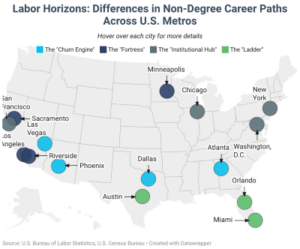
The Fortress
Minneapolis is another interesting case. Here, roughly half of the mid-skill jobs available in the area provide earnings that are above the local median salary. However, only 39% of mid-skill workers in Minneapolis are employed in roles that earn more than $55,795.
Overall, while the cost-of-living advantage is no longer quite as marked in non-coastal cities as it was a few years ago, it remains an important factor in keeping wages lower than in places like Los Angeles or Riverside, Calif., where a higher salary becomes imperative to retain and maintain a qualified workforce within a reasonable commuting distance.
The Churn Engine
Phoenix
The high job-to-job flow in Phoenix signals a very different economic model — one defined by rapid expansion, low barriers to entry and high replaceability. Consequently, mid-skill workers in industries such as construction, hospitality or general services frequently jump between similar roles, which creates plenty of movement in the labor market (27% job-to-job flow rate). But, from an employee point of view, it often ends up being a sideways step in terms of pay. Indeed, precisely because there’s a constant supply of new labor, employers don’t feel the same pressure to pay a massive “retention premium” as they do in a more specialized metro area like Riverside, Calif. Furthermore, Phoenix firms also benefit from the fact that they don’t need to compete with another neighboring major hub (as is the case in southern California).
Las Vegas
Las Vegas is arguably one of the most extreme cases of “churn engines” on the list with the highest job-to-job flow rate (29%). For reference, the average rate for metro areas in our analysis (population above 1 million residents) is 18%. In Sin City, 52% of mid-skill jobs pay above the median wage with 41% of workers employed in these high-paying roles. However, looking at the bigger picture, income growth for mid-skill jobs in Las Vegas has been below average (26%, compared to the 32% average across the list). Starting from $37,941 in 2014, the median salary for mid-skilled workers reached $47,880 per year in 2024. That makes it the second-lowest median wage for workers in this category among the 36 metro areas we looked at. San Antonio claimed the lowest mark with $45,831.
The Ladder
Miami
Unlike “fortress” cities — such as Riverside, Calif., or Minneapolis, which protect or “lock-in” a specialized workforce — or the “churn engines” of Phoenix and Las Vegas, which process volume, a “ladder” metro area like Miami offers plenty of opportunities for upward movement. As high finance, health care and tech moved into south Florida, they raised the ceiling for support roles. Now, Miami’s mid-skill labor force is no longer as heavily reliant on the tourism sector for employment. Indeed, among the metropolitan areas that made our ranking, Miami has one of the lowest gaps between the share of mid-level roles that provide higher-than-average pay (41%) and actual percentage of people employed in those types of jobs (35%).
Orlando & Austin
Both Orlando, Fla., and Austin, Texas, have below-average job-to-job flow rates (15%), along with above-average wage growth for mid-level wages between 2014 and 2024. In Orlando, a 38% hike brought the median salary for mid-skill jobs to $47,885 per year, while Austin’s reached $50,886 per year following a 34% increase.
The extremely tight gap between mid-skill positions that provide above-median wages (43%) and actual employment for these positions (40%) makes Austin a highly efficient market for matching mid-skill workers with the most well-paid job openings. Similar to Orlando, advanced manufacturing and defense sector employers (like Tesla, Samsung and BAE Systems), are the ones driving demand for these kinds of jobs, and the local community college and university pipeline is intentionally designed to nurture the talent needed for these sectors.
The Institutional Hub
New York; Washington, D.C.; San Francisco; & Chicago
Metros that fit this category (New York, Washington, D.C., Chicago and San Francisco) are home to several massive organizations—universities, government agencies, global banks, and legacy healthcare systems—that require specialized support staff to keep their complex operations running. These labor markets can come across as somewhat resembling a walled garden: they have high barriers of entry (due to licensing or credentials required), modest wage growth but offer increased stability and benefits.
For example, academic and medical research centers — such as Kaiser Permanente and UCSF in San Francisco, as well as Northwestern Medicine in Chicago — require mid-skilled professionals to manage patient data, compliance and scheduling for massive clinical trials. Likewise, the federal government and defense contractors in Washington, D.C. rely on mid-skilled workers with specialized certifications to act as cybersecurity support technicians.
Among these four metros, New York and San Francisco have below average job-to-job flow rates (when compared to U.S. metros with more than 1 million residents included in our analysis), while Chicago and Washington, D.C. are more dynamic in that regard.
In New York, job-to-job flow rates stand at 15%, which is below the average among the metro areas in our analysis. Here, the high cost of living can add extra pressure and risk to job transitions. Coupled with the fact that large employers like NYU or Goldman Sachs tend to offer benefit packages — such as childcare, pensions and comprehensive health — as well as union protection or tenure stability, mid-skilled workers often think twice about the pros and cons of a move.
Reinforcing this image of the walled garden, these hubs also display significant differences between the percentage of high-paying, mid-skill positions and employment share in those roles. For instance, New York City boasts the highest share of mid-skill jobs that pay above median wage (54%), but employment in this high-earning bracket stands at 42%. On the opposite coast, the opportunity gap is even wider in San Francisco (13% difference).
These metropolitan areas are also defined by relatively modest wage growth across the surveyed period. As an example, the largest increase in earnings for mid-skill employees in this group took place in Chicago, where the median salary for these workers reached $54,793 in 2024, following a 31% hike. Finally, a 25% jump brought the median wage for mid-skill jobs in San Francisco to $65,212 per year, while New York’s 22% growth resulted in a yearly $58,038.
Chicago
Methodology
For the purposes of this study, we compiled a list of all metropolitan statistical areas (MSAs) with more than 1 million residents, which we then graded for indicators listed below. Averages were then set for each metric and an MSA’s position relative to it was used to determine the labor market archetype that best describes its characteristics.
“% Change in median wages for mid-skilled workers” refers to the relative difference in each metropolitan area’s median salaries for mid-skilled workers (defined as people with a high school diploma; associate’s degree or some college; or no degree) between 2014 and 2024. Based on Bureau of Labor Statistics data.
“Mid-skill employment %” represents the proportion of mid-skilled employees across each metropolitan area’s total employment, based on the latest available Bureau of Labor Statistics data. The values represent 2024 percentages.
“Mid-skill occupations with above-median income” refers to the percentage of mid-skill level job titles that offer wages higher than the metropolitan area’s median. Based on the latest available Bureau of Labor Statistics data. The values represent 2024 percentages.
“Mid-skill employment with above-median income” is the percentage of mid-skilled employees earning wages that are higher than the metropolitan area’s median. Based on the latest available Bureau of Labor Statistics data. The values represent 2024 percentages.
“Job-to-job flow rate” illustrates the percentage of employed mid-skilled workers who move to a new employer from one quarter to the next without a significant gap in employment (unemployment). It serves as a key indicator of labor market tightness and worker bargaining power, reflecting how often employees voluntarily switch jobs to seek higher wages or better conditions. Based on the latest available U.S. Census Bureau data. The values represent 2023 percentages.
“Job-to-job flow rate across various educational attainment levels” is a customized version of the previous indicator, highlighting differences in outcome according to the three main educational backgrounds associated with mid-skilled workers (high school diploma; associate’s degree or some college; or no degree). Based on the latest available U.S. Census Bureau data. The values represent 2023 percentages.
This is how the metro areas stacked up in this preliminary stage:
| Average Values | – | 32% | 38% | 45% | 37% | 18% | 6% | 7% | 4% |
|---|---|---|---|---|---|---|---|---|---|
| San Jose-Sunnyvale-Santa Clara, CA | 24.3 | 35% | 31% | 44% | 35% | 7% | −4% | −1% | −9% |
| San Francisco-Oakland-Fremont, CA | 36.8 | 25% | 36% | 50% | 37% | 10% | −1% | 2% | −2% |
| Washington-Arlington-Alexandria, DC-VA-MD-WV | 38.7 | 26% | 30% | 45% | 38% | 19% | 7% | 8% | 6% |
| Boston-Cambridge-Newton, MA-NH | 44.5 | 26% | 34% | 46% | 39% | 16% | 5% | 6% | 3% |
| Philadelphia-Camden-Wilmington, PA-NJ-DE-MD | 49.1 | 21% | 40% | 50% | 35% | 15% | 7% | 10% | 7% |
| Austin-Round Rock-San Marcos, TX | 49.5 | 34% | 36% | 43% | 39% | 15% | 3% | 4% | 1% |
| Detroit-Warren-Dearborn, MI | 50.3 | 28% | 41% | 41% | 34% | 17% | 10% | 12% | 8% |
| Houston-Pasadena-The Woodlands, TX | 50.4 | 22% | 39% | 43% | 38% | 20% | 6% | 7% | 5% |
| Cleveland, OH | 50.7 | 32% | 40% | 41% | 34% | 17% | 8% | 9% | 7% |
| Atlanta-Sandy Springs-Roswell, GA | 51.1 | 33% | 37% | 38% | 35% | 27% | 5% | 6% | 4% |
| Columbus, OH | 51.6 | 37% | 37% | 43% | 34% | 18% | 5% | 7% | 4% |
| Nashville-Davidson–Murfreesboro–Franklin, TN | 51.7 | 37% | 39% | 40% | 34% | 21% | 4% | 6% | 4% |
| Baltimore-Columbia-Towson, MD | 53.5 | 30% | 36% | 46% | 38% | 17% | 8% | 9% | 7% |
| Charlotte-Concord-Gastonia, NC-SC | 53.9 | 32% | 37% | 43% | 39% | 19% | 4% | 6% | 3% |
While the initial ranking encompasses eight different indicators, our metro-level analysis focuses on five of them to identify patterns in how mid-skill labor is integrated and what career advancement prospects workers can look forward to in these places.
First, we look at median wage growth for mid-skill jobs between 2014 and 2024 as a reference point for the types of earnings that professionals can expect working in each metro area. Next, job-to-job flow rates measure how “locked-in” workers within a market are or how likely they are to switch jobs. We also look at the opportunity gap, which we defined as the difference between the percentage of high-paying job titles available and the percentage of people in those seats. For instance, entries with a wide opportunity gap point to labor markets in which there are a variety of occupations that provide higher wages, but only a few of these actually employ a significant number of people within the given workforce.
Finally, we also took into consideration mid-skill labor density, or the total footprint of mid-skill workers within each entry’s workforce. The table below displays the performances of all metropolitan areas with more than 1 million residents across the set of metrics included in this study, including the ranking-wide average for each indicator to provide a better reference point.
Mid-Skill Jobs Definition
Based on labor market standards, mid-skill occupations are defined by the level of educational attainment typically required for entry into the field. These roles generally sit between entry-level positions requiring no formal education and high-skill roles that necessitate a bachelor’s degree or higher.
According to the criteria provided by the U.S. Census Bureau and the Bureau of Labor Statistics, mid-skill employment includes positions where the typical entry-level requirement is:
- a high-school diploma or equivalent
- an associate’s degree
- some college, but no degree
This category often encompasses a broad range of technical and specialized roles — such as those in advanced manufacturing, health care support and logistics — where specialized training or vocational certification is more critical than a traditional, four-year academic degree.